
To better understand a business I find it helpful to break down the relevant unit (or project) economics. Here I looked at the project economics of 3 project types in Boston Omaha’s broadband segment. This exercise helped me to better understand future cash flows and management’s stated IRR figures.
Greenfield Projects
Management shared:
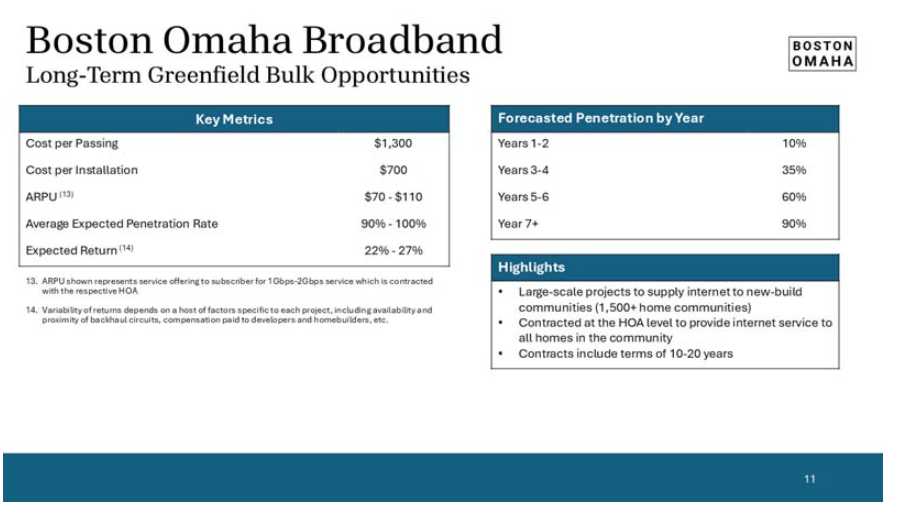
Which when extrapolated we get the following cash flow predictions:
| Year | Net Cash Flow ($) | ROI |
| 0 | -1,950,000 | |
| 1 | 8,400 | 0.43% |
| 2 | 113,400 | 5.82% |
| 3 | 134,400 | 6.89% |
| 4 | 396,900 | 20.35% |
| 5 | 417,900 | 21.43% |
| 6 | 680,400 | 34.89% |
| 7 | 705,600 | 36.18% |
| 8 | 1,020,600 | 52.34% |
| 9 | 1,020,600 | 52.34% |
| 10+ | 1,020,600 | 52.34% |
For these estimates to match management’s guidelines I had to assume a 10% variable annual cost of revenue for ongoing service and maintenance.
Manufactured Home Projects
Management shared:
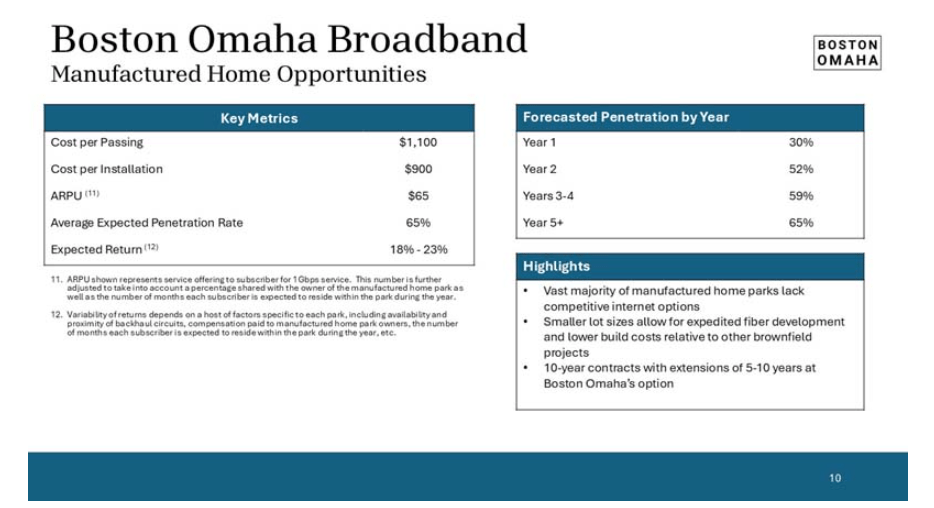
For this we get the following extrapolation, assuming a 200 home project:
| Year | Net Cash Flow ($) | ROI |
| 0 | -220,000 | |
| 1 | -3,960 | -1.80% |
| 2 | 14,040 | 6.38% |
| 3 | 4,140 | 1.88% |
| 4 | 49,140 | 22.34% |
| 5 | 39,240 | 17.84% |
| 6 | 84,240 | 38.29% |
| 7 | 72,360 | 32.89% |
| 8 | 126,360 | 57.44% |
| 9 | 126,360 | 57.44% |
| 10+ | 126,360 | 57.44% |
For these estimates to match management’s guidelines I had to assume an additional 10-20% variable cost on revenue (as a fee to the property owner) to arrive at a 18-23% return.
Brownfield Projects
Management shared:
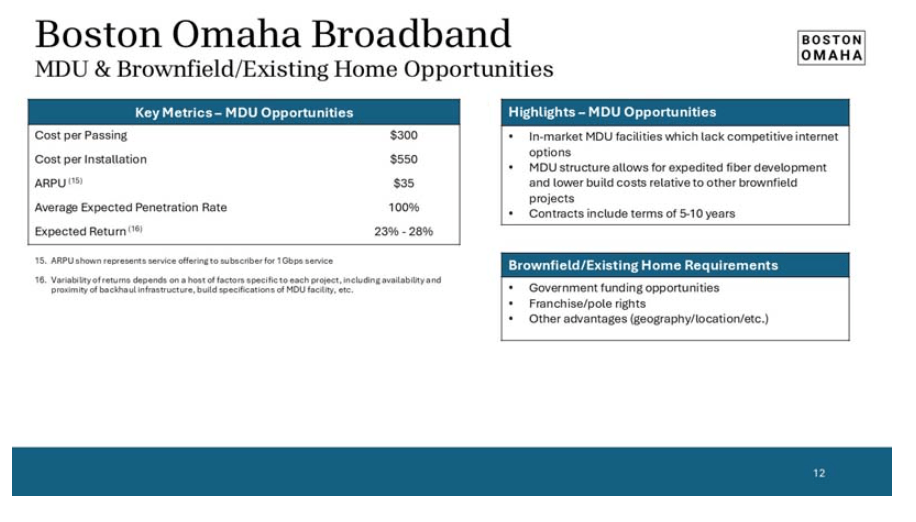
Which I lay out like:
| Year | Net Cash Flow ($) | ROI |
| 0 | -60,000 | |
| 1 | -4,280 | -7.13% |
| 2 | 6,720 | 11.20% |
| 3 | -3,980 | -6.63% |
| 4 | 23,520 | 39.20% |
| 5 | 12,820 | 21.37% |
| 6 | 40,320 | 67.20% |
| 7 | 27,480 | 45.80% |
| 8 | 60,480 | 100.80% |
| 9 | 60,480 | 100.80% |
| 10+ | 60,480 | 100.80% |
For this to match management guidelines I had to add an additional 10% variable cost of revenue to account for the franchise fee / pole rights.
Conclusion
This allayed whatever concerns I had left over the broadband segment of BOC. You can see that on the project level, net cash flows look dismal for the first 3 years of the project, which is what we are seeing on the income statements now. However, at a project level it is clear that BOC management is making good investments that will provide steady future cash flows.
Sources:
Management’s Presentation to Shareholders: https://www.sec.gov/ix?doc=/Archives/edgar/data/0001494582/000143774924029649/bomn20240919_8k.htm
My Spreadsheet: https://docs.google.com/spreadsheets/d/1shoFrDwd8KMUiAm3C11csPqtSrauCEWm/edit?usp=sharing&ouid=101547994977893799459&rtpof=true&sd=true

Leave a comment